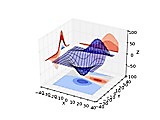
 Python matplotlib is a for 2D plotting publication-ready figures in various formats, or rendering them interactively cross-platform. It can be scripted or used in Pythons interactive shell, within web applications, or through bindings with multiple GUI toolkits. It simplifies plot generation, histograms, power spectra, bar charts, error charts, scatter plots. Typical uses only require a few lines of code, while complex rendering is kept feasible. Its pyplot interface provides a MATLAB-style API.
 LabPlot is a FREE, open source and cross-platform Data Visualization and Analysis software accessible to everyone. High-quality Data Visualization and Plotting with just a few clicks Reliable and easy Data Analysis and Statistics, no coding required! Intuitive and fast Computing with Interactive Notebooks Effortless Data Extraction from plots and support for Live Data Smooth Data Import and Export to and from multiple formats Available for Windows, macOS, Linux and FreeBSD
This version manage the Munin graph in PHP without using the RRD Graph. It manage all the graphs in JS in the client browser (which allow the server to keep cool),
LabPlot is a FREE, open source and cross-platform Data Visualization and Analysis software accessible to everyone. High-quality Data Visualization and Plotting with just a few clicks Reliable and easy Data Analysis and Statistics, no coding required! Intuitive and fast Computing with Interactive Notebooks Effortless Data Extraction from plots and support for Live Data Smooth Data Import and Export to and from multiple formats Available for Windows, macOS, Linux and FreeBSD
This version manage the Munin graph in PHP without using the RRD Graph. It manage all the graphs in JS in the client browser (which allow the server to keep cool),
|