 Heaptrack traces all memory allocations and annotates these events with stack traces. Dedicated analysis tools then allow you to interpret the heap memory profile to: Find hotspots that need to be optimized to reduce the memory footprint of your application Find memory leaks, i.e. locations that allocate memory which is never deallocated Find allocation hotspots, i.e. code locations that trigger a lot of memory allocation calls Find temporary allocations, which are allocations that are directly
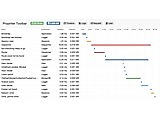 Prophiler is a PHP runtime debugger and profiler. It manually hooks into application structures to visualize code flow and time consumption. Browser-style tabbed graphs ease performance introspection, and a specific PDO decorator can profile database calls even.
 ENdoSnipe is a Java systems performance profiler and introspection tool. It can monitor a runtime on multiple servers, visalize the application flow (threads and processes in a sequence diagram). It utilizes bytecode instrumentation (BCI) debugging in the JVM to detect possible bugs and performance issues.
 Zorka is a sophisticated programmable profiling/monitoring agent for Java suitable for running with production applications. The agent integrates seamlessly with popular monitoring systems and protocols (Zabbix, Nagios, syslog, SNMP) and offers additional tracing/profiling capabilities that - along with the accompanying data collector - help with spotting performance issues and general problems. The agent also exposes JMX data to conventional monitoring systems. Platforms (more or less) suppo
|