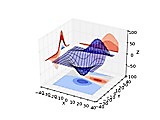
 Python matplotlib is a for 2D plotting publication-ready figures in various formats, or rendering them interactively cross-platform. It can be scripted or used in Pythons interactive shell, within web applications, or through bindings with multiple GUI toolkits. It simplifies plot generation, histograms, power spectra, bar charts, error charts, scatter plots. Typical uses only require a few lines of code, while complex rendering is kept feasible. Its pyplot interface provides a MATLAB-style API.
 MathMod is a portable interactive plotting and graphing program for Windows, Linux, MacOSX and many other platforms. MathMod allows to plot 3D mathematical surfaces, described by implicit or parametric equations, and offers a very large database of model samples that can be generated with it. It's Free and Open Source under the terms of the GPL licence version 2 or later.
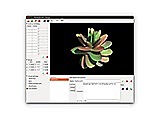 Functy is a 3D graphics generation tool. It plots cartesian, spherical or parametric curve functions. It allows altering their parameters for immediate redraws to explore 3D function results. It utilized GPU functions entirely for visualization.
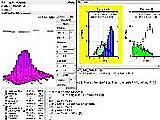 SCaVis is an environment for scientific computation, data analysis and data visualization designed for scientists, engineers and students. While itself implemented in Java, it provides bindings for Jython, Groovy, JRuby, BeanShell or Matlab/Octav for symbolic calculations. It features chart plotting, histograms, advanced statistics, symbolic calculations, data analysis, mathematical functions, data mining, linear algebra and plots.
|