SCaVis is an environment for scientific computation, data analysis and data visualization designed for scientists, engineers and students. While itself implemented in Java, it provides bindings for Jython, Groovy, JRuby, BeanShell or Matlab/Octav for symbolic calculations.
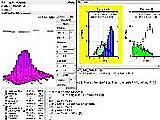
It features chart plotting, histograms, advanced statistics,
symbolic calculations, data analysis, mathematical functions, data mining, linear algebra and plots.
 Homepage
 Download
Recent Releases
2.316 Feb 2015 19:25
minor feature:
This is a beta version. The current work focuses on redesigning some
libraries to be able to provide a commercially friendly licenses.
2.207 Dec 2014 23:25
minor feature:
A new canvas HPlotXY for interactive data drawings
2) Support for jplot2d package, inclusing SVG and SVGZ outputs
3) Added 40 Java and Jython examples
4) A bug in ScaVis IDE that prevent Java code for running was fixed
S.Chekanov, jWork.ORG
December 4, 2014
2.128 Oct 2014 03:17
minor feature:
Support for n-dimensional arrays like Numpy
The coding is based on ND4J and JBLAS
All matrix packages were moved to lib/math
1.820 Jul 2014 16:43
major feature:
Support for Redberry computer algebra system added.
Adaptive histograms (H1DA class in jhplot) introduced.
Trove version 3.03 and Kalmar filter.
Calculations with units (Tools- Unit calculations) and corrected unit conversion tools.
And log4j.properties is included and start-up scripts corrected.