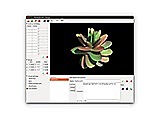
 CubicSDR is a cross-platform Software-Defined Radio application which allows you to navigate the radio spectrum and demodulate any signals you might discover. It currently includes several common analog demodulation schemes such as AM and FM and will support digital modes in the future. Many digital decoding applications are available now that can use the analog outputs to process digital signals by “piping” the data from CubicSDR to another program using software like Soundflower, Jack Audio
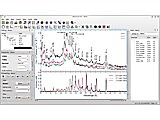
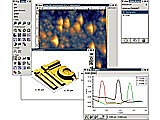 Gwyddion is a modular SPM (Scanning Probe Microsope) data visualization and analysis tool. It can be used for all most frequently used data processing operations including: leveling, false color plotting, shading, filtering, denoising, data editing, integral transforms, grain analysis, profile extraction, fractal analysis, and many more. The program is primarily focused on SPM data analysis (e.g. data obtained from AFM, STM, NSOM, and similar microscopes). However, it can also be used for analyz
Core Features of ParaView Displaying Data -You can create different views to visualize data simultaneously and easily identify corresponding data elements. These views can also be customized (e.g. creating C++ plugins to add new types of views). Filtering Data Transform your data to generate visualizations that are easier to understand using ParaView filters. While an extensive list of filters is already provided, you can add custom filtering operations through Python scripting via a plugin or
The Visualization Toolkit (VTK) is open source software for manipulating and displaying scientific data. It comes with state-of-the-art tools for 3D rendering, a suite of widgets for 3D interaction, and extensive 2D plotting capability. VTK is part of Kitware’s collection of supported platforms for software development. The platform is used worldwide in commercial applications, as well as in research and development.
GEGL (Generic Graphics Library) is a data flow based image processing framework, providing floating point processing and non-destructive image processing capabilities to GNU Image Manipulation Program and other projects (imgflo, GNOME Photos, gcut, iconographer, …) With GEGL you chain together processing operations to represent the desired image processing pipeline. GEGL provides operations for image loading and storing, color adjustments, GIMPs artistic filters and more forms of image processi
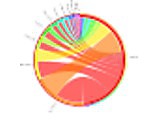
Graphviz is open source graph visualization software. Graph visualization is a way of representing structural information as diagrams of abstract graphs and networks. It has important applications in networking, bioinformatics, software engineering, database and web design, machine learning, and in visual interfaces for other technical domains.
Gwyddion is a modular SPM (Scanning Probe Microsope) data visualization and analysis tool. It can be used for all most frequently used data processing operations including: leveling, false color plotting, shading, filtering, denoising, data editing, integral transforms, grain analysis, profile extraction, fractal analysis, and many more. The program is primarily focused on SPM data analysis (e.g. data obtained from AFM, STM, NSOM, and similar microscopes). However, it can also be used for analyz
Core Features of ParaView Displaying Data -You can create different views to visualize data simultaneously and easily identify corresponding data elements. These views can also be customized (e.g. creating C++ plugins to add new types of views). Filtering Data Transform your data to generate visualizations that are easier to understand using ParaView filters. While an extensive list of filters is already provided, you can add custom filtering operations through Python scripting via a plugin or
The Visualization Toolkit (VTK) is open source software for manipulating and displaying scientific data. It comes with state-of-the-art tools for 3D rendering, a suite of widgets for 3D interaction, and extensive 2D plotting capability. VTK is part of Kitware’s collection of supported platforms for software development. The platform is used worldwide in commercial applications, as well as in research and development.
GEGL (Generic Graphics Library) is a data flow based image processing framework, providing floating point processing and non-destructive image processing capabilities to GNU Image Manipulation Program and other projects (imgflo, GNOME Photos, gcut, iconographer, …) With GEGL you chain together processing operations to represent the desired image processing pipeline. GEGL provides operations for image loading and storing, color adjustments, GIMPs artistic filters and more forms of image processi
Graphviz is open source graph visualization software. Graph visualization is a way of representing structural information as diagrams of abstract graphs and networks. It has important applications in networking, bioinformatics, software engineering, database and web design, machine learning, and in visual interfaces for other technical domains.
 Bokeh is an interactive visualization library for modern web browsers. It provides elegant, concise construction of versatile graphics, and affords high-performance interactivity over large or streaming datasets. Bokeh can help anyone who would like to quickly and easily make interactive plots, dashboards, and data applications.
CGAL is a software project that provides easy access to efficient and reliable geometric algorithms in the form of a C++ library. CGAL is used in various areas needing geometric computation, such as geographic information systems, computer aided design, molecular biology, medical imaging, computer graphics, and robotics. The library offers data structures and algorithms like triangulations, Voronoi diagrams, Boolean operations on polygons and polyhedra, point set processing, arrangements of cur
Bokeh is an interactive visualization library for modern web browsers. It provides elegant, concise construction of versatile graphics, and affords high-performance interactivity over large or streaming datasets. Bokeh can help anyone who would like to quickly and easily make interactive plots, dashboards, and data applications.
CGAL is a software project that provides easy access to efficient and reliable geometric algorithms in the form of a C++ library. CGAL is used in various areas needing geometric computation, such as geographic information systems, computer aided design, molecular biology, medical imaging, computer graphics, and robotics. The library offers data structures and algorithms like triangulations, Voronoi diagrams, Boolean operations on polygons and polyhedra, point set processing, arrangements of cur
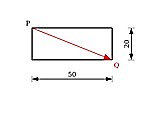 Drawj2d creates technical line drawings using a descriptive language. It writes pdf, svg, eps and emf vector graphics or png images. It runs on all platforms that run Java. It is inspired by Asymptote but with a tcl-like syntax and 2D only.
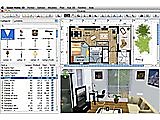 Sweet Home 3D is an interior design application that helps you to quickly draw the floor plan of your house, arrange furniture on it, and visit the results in 3D.
Squey is designed from the ground up to take advantage of GPUs and CPUs to perform interactive explorations of massive amounts of data. It gives users an exhaustive yet intuitive multi-view representation of columnar data and can ingest from: 1. Structured text files (CSV, logs, ...) 2. Apache Parquet files 3. Pcap files 4. SQL databases 5. Elasticsearch databases Squey strives to deliver value through its V.I.SU approach: - Visualize: Leverage various visual representa
Sweet Home 3D is an interior design application that helps you to quickly draw the floor plan of your house, arrange furniture on it, and visit the results in 3D.
Squey is designed from the ground up to take advantage of GPUs and CPUs to perform interactive explorations of massive amounts of data. It gives users an exhaustive yet intuitive multi-view representation of columnar data and can ingest from: 1. Structured text files (CSV, logs, ...) 2. Apache Parquet files 3. Pcap files 4. SQL databases 5. Elasticsearch databases Squey strives to deliver value through its V.I.SU approach: - Visualize: Leverage various visual representa
 MathMod is a portable interactive plotting and graphing program for Windows, Linux, MacOSX and many other platforms. MathMod allows to plot 3D mathematical surfaces, described by implicit or parametric equations, and offers a very large database of model samples that can be generated with it. It's Free and Open Source under the terms of the GPL licence version 2 or later.
spettro shows a scrolling logarithmic-frequency-axis spectrogram of sound files as it plays them. You can also: * Pause, continue, rewind and seek back and forth in the audio * Zoom and pan in time and in frequency * Adjust the brightness and dynamic range (contrast) * Change the FFT sample size to adjust the relative frequency/time resolution * Select from five different FFT window functions * Show where the ten score lines, six guitar strings or 88 piano keys fall * Position bar lines
Query and Visualize the network graph of your GitHub repositories, followers, stargazers, and forks (using GraphQL and D3).
GPlates is a plate tectonics program. Manipulate reconstructions of geological and paleogeographic features through geological time. Interactively visualize vector, raster and volume data. PyGPlates is the GPlates Python library. Get fine-grained access to GPlates functionality in your Python scripts.
Geant4 is a toolkit for the simulation of the passage of particles through matter. Its areas of application include high energy, nuclear and accelerator physics, as well as studies in medical and space science. There are three main reference papers for Geant4: Nuclear Instruments and Methods in Physics Research A 835 (2016) 186-225 IEEE Transactions on Nuclear Science 53 No. 1 (2006) 270-278 Nuclear Instruments and Methods in Physics Research A 506 (2003) 250-303
MathMod is a portable interactive plotting and graphing program for Windows, Linux, MacOSX and many other platforms. MathMod allows to plot 3D mathematical surfaces, described by implicit or parametric equations, and offers a very large database of model samples that can be generated with it. It's Free and Open Source under the terms of the GPL licence version 2 or later.
spettro shows a scrolling logarithmic-frequency-axis spectrogram of sound files as it plays them. You can also: * Pause, continue, rewind and seek back and forth in the audio * Zoom and pan in time and in frequency * Adjust the brightness and dynamic range (contrast) * Change the FFT sample size to adjust the relative frequency/time resolution * Select from five different FFT window functions * Show where the ten score lines, six guitar strings or 88 piano keys fall * Position bar lines
Query and Visualize the network graph of your GitHub repositories, followers, stargazers, and forks (using GraphQL and D3).
GPlates is a plate tectonics program. Manipulate reconstructions of geological and paleogeographic features through geological time. Interactively visualize vector, raster and volume data. PyGPlates is the GPlates Python library. Get fine-grained access to GPlates functionality in your Python scripts.
Geant4 is a toolkit for the simulation of the passage of particles through matter. Its areas of application include high energy, nuclear and accelerator physics, as well as studies in medical and space science. There are three main reference papers for Geant4: Nuclear Instruments and Methods in Physics Research A 835 (2016) 186-225 IEEE Transactions on Nuclear Science 53 No. 1 (2006) 270-278 Nuclear Instruments and Methods in Physics Research A 506 (2003) 250-303
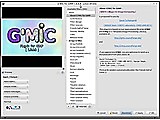 G'MIC (GREYC's Magic for Image Computing) is a portable and scriptable image processing framework. It comes as C++ library, can be used as command line tool, as Gimp plugin, as web service, or with its Qt application. G'MIC allows image conversion, manipulation, applying complex filters and visualization pipelines. Various image types can be used, 1D/2D/3D sources, multi-spectral and volumetric images or 3D vector objects, regardless of pixel depths. The "gmic" command line tool is often an alte
The OpenSceneGraph is an open source high performance 3D graphics toolkit, used by application developers in fields such as visual simulation, games, virtual reality, scientific visualization and modelling. Written entirely in Standard C++ and OpenGL it runs on all Windows platforms, OSX, GNU/Linux, IRIX, Solaris, HP-Ux, AIX and FreeBSD operating systems. The OpenSceneGraph is now well established as the world leading scene graph technology, used widely in the vis-sim, space, scientific, oil-gas
A typical application developed using OCCT deals with two or three-dimensional (2D or 3D) geometric modeling in general-purpose or specialized Computer Aided Design (CAD) systems, manufacturing or analysis applications, simulation applications, or even illustration tools.library designed for rapid production of sophisticated domain-specific CAD/CAM/CAE applications
Savant is an open-source, high-level framework for building real-time, streaming, highly efficient multimedia AI applications on the Nvidia stack. It helps to develop dynamic, fault-tolerant inference pipelines that utilize the best Nvidia approaches for data center and edge accelerators. Savant is built on DeepStream and provides a high-level abstraction layer for building inference pipelines. It is designed to be easy to use, flexible, and scalable. It is a great choice for building smart CV
eXtace is a Audio Visualization plugin for the X-Window System. It connects to ESD (Enlightened Sound Daemon) and displays the audio data as either a pseudo 3D flying landscape, pseudo 3D pointed landscape, 16-256 channel graphic EQ, multi-mode Oscilloscopes, Horizontal Spectrogram, or a combination Hi-res FFT with a Vertical Spectrogram. All modes are fully scalable to nearly ANY resolution! (within your CPU/X11 capabilites) Resolutions up to 1600x1200 at 40 FPS use typially less than 30% CPU,
G'MIC (GREYC's Magic for Image Computing) is a portable and scriptable image processing framework. It comes as C++ library, can be used as command line tool, as Gimp plugin, as web service, or with its Qt application. G'MIC allows image conversion, manipulation, applying complex filters and visualization pipelines. Various image types can be used, 1D/2D/3D sources, multi-spectral and volumetric images or 3D vector objects, regardless of pixel depths. The "gmic" command line tool is often an alte
The OpenSceneGraph is an open source high performance 3D graphics toolkit, used by application developers in fields such as visual simulation, games, virtual reality, scientific visualization and modelling. Written entirely in Standard C++ and OpenGL it runs on all Windows platforms, OSX, GNU/Linux, IRIX, Solaris, HP-Ux, AIX and FreeBSD operating systems. The OpenSceneGraph is now well established as the world leading scene graph technology, used widely in the vis-sim, space, scientific, oil-gas
A typical application developed using OCCT deals with two or three-dimensional (2D or 3D) geometric modeling in general-purpose or specialized Computer Aided Design (CAD) systems, manufacturing or analysis applications, simulation applications, or even illustration tools.library designed for rapid production of sophisticated domain-specific CAD/CAM/CAE applications
Savant is an open-source, high-level framework for building real-time, streaming, highly efficient multimedia AI applications on the Nvidia stack. It helps to develop dynamic, fault-tolerant inference pipelines that utilize the best Nvidia approaches for data center and edge accelerators. Savant is built on DeepStream and provides a high-level abstraction layer for building inference pipelines. It is designed to be easy to use, flexible, and scalable. It is a great choice for building smart CV
eXtace is a Audio Visualization plugin for the X-Window System. It connects to ESD (Enlightened Sound Daemon) and displays the audio data as either a pseudo 3D flying landscape, pseudo 3D pointed landscape, 16-256 channel graphic EQ, multi-mode Oscilloscopes, Horizontal Spectrogram, or a combination Hi-res FFT with a Vertical Spectrogram. All modes are fully scalable to nearly ANY resolution! (within your CPU/X11 capabilites) Resolutions up to 1600x1200 at 40 FPS use typially less than 30% CPU,
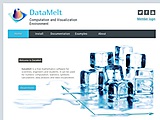 DataMelt is a program for numeric computation, mathematics, statistics, symbolic calculations, data analysis and data visualization. It supports several scripting languages, such as Python, Ruby, Groovy (and others), with the power of hundreds of Java packages. Available for Windows, Linux and Mac OS.
 Veusz is a scientific plotting package, designed to create publication-ready Postscript, PDF, or SVG output. It features an easy to use graphical interface as well as a command line interface and can be scripted or embedded in Python scripts. Graphs are constructed in a modular fashion from separate components. Datasets can be interactively modified or created from within the program.
Nelson is an array programming language providing a powerful open computing environment for engineering and scientific applications using modern C/C++ libraries (Boost, Eigen, …) and others state of art numerical libraries. It has sophisticated data structures (including cell, struct, linear systems, …), an interpreter and a high level programming language. Nelson has been developped to be an open/modular system where an user can define these own data types and operations on these data types b
directed graph layout program with a GTK+ gui which can read partial gml or dot graph data
ClickMaster2000 is a simple tally counter for images. You can load images containing objects that need to be counted, click on each one of them, and then read the total without having to keep mental record. ClickMaster2000 is geared for batch, precise counting on dense images where automated recognition is not easily possible. ClickMaster2000 was originally designed for microbiology imagery.
Veusz is a scientific plotting package, designed to create publication-ready Postscript, PDF, or SVG output. It features an easy to use graphical interface as well as a command line interface and can be scripted or embedded in Python scripts. Graphs are constructed in a modular fashion from separate components. Datasets can be interactively modified or created from within the program.
Nelson is an array programming language providing a powerful open computing environment for engineering and scientific applications using modern C/C++ libraries (Boost, Eigen, …) and others state of art numerical libraries. It has sophisticated data structures (including cell, struct, linear systems, …), an interpreter and a high level programming language. Nelson has been developped to be an open/modular system where an user can define these own data types and operations on these data types b
directed graph layout program with a GTK+ gui which can read partial gml or dot graph data
ClickMaster2000 is a simple tally counter for images. You can load images containing objects that need to be counted, click on each one of them, and then read the total without having to keep mental record. ClickMaster2000 is geared for batch, precise counting on dense images where automated recognition is not easily possible. ClickMaster2000 was originally designed for microbiology imagery.
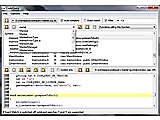 CodeQuery is a tool for indexing and then querying or searching C, C++, Java, Python, Ruby, and Go source code. It builds upon the databases of cscope and ctags, which are processed by the cqmakedb tool to generate a CodeQuery database file. This can be viewed and queried with a GUI tool. The features include auto-completion of search terms and visualization of function call graphs and class inheritance. The following queries can be made: Symbol, Function or macro, Class or struct, Functions cal
 Small utility to make cvsgraph ( http://www.akhphd.au.dk/~bertho/cvsgraph/ ) useful also for subversion users
 Dowse is a transparent proxy facilitating the awareness of ingoing and outgoing connections, from, to, and within a local area network. Dowse provides a central point of soft control for all local traffic: from ARP traffic (layer 2) to TCP/IP (layers 3 and 4) as well as application space, by chaining a firewall setup to a trasparent proxy setup. A core feature for Dowse is that of hiding all the complexity of such a setup.
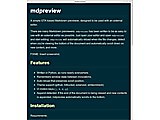 A simple GTK-based Markdown previewer, designed to be used with an external editor. There are many Markdown previewers. mdpreview has been written to be as easy to use with an external editor as possible. Just open mdpreview, open your editor and start editing. mdpreview will automatically reload when the file changes, detect when you're viewing the bottom of the document and automatically scroll down on new content, and more. It includes themes that closely resemble github, and bitbucket.
 The goal of IP-Link is to see the relationships between different IP from network traffic capture, thus quickly for a given address with the IP that communicates the most. IP-Link offers several visualization methods.
 Functy is a 3D graphics generation tool. It plots cartesian, spherical or parametric curve functions. It allows altering their parameters for immediate redraws to explore 3D function results. It utilized GPU functions entirely for visualization.
 Unchain your data ! The combination of both graphic map and classic charts, leads to a complete and interactive dashboard for rapid information access. FreeDatamap provides a unique way to browse any kind of data. FreeDatamap helps turning flat and boring sheets of data into a unique visual compelling dashboard. At the crossroads of mind-mapping and business-intelligence: FreeDatamap delivers a fast and visually attractive user interface that runs on any support: computers, tablets or phones
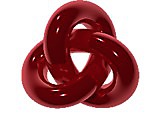
 ODE is a high performance library for simulating rigid body dynamics. It is fully featured, stable, mature, and platform independent with an easy-to-use C/C++ API. It has advanced joint types and integrated collision detection with friction. ODE is useful for simulating vehicles, objects in virtual reality environments, and virtual creatures. It is currently used in many computer games, 3D authoring tools, and simulation tools.
 ODE is a high performance library for simulating rigid body dynamics. It is fully featured, stable, mature, and platform independent with an easy-to-use C/C++ API. It has advanced joint types and integrated collision detection with friction. ODE is useful for simulating vehicles, objects in virtual reality environments, and virtual creatures. It is currently used in many computer games, 3D authoring tools, and simulation tools.
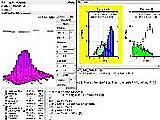 SCaVis is an environment for scientific computation, data analysis and data visualization designed for scientists, engineers and students. While itself implemented in Java, it provides bindings for Jython, Groovy, JRuby, BeanShell or Matlab/Octav for symbolic calculations. It features chart plotting, histograms, advanced statistics, symbolic calculations, data analysis, mathematical functions, data mining, linear algebra and plots.
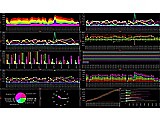 Savors can visualize multiple data streams from arbitrary input pipes. It synchronizes them in accordance to elapsed time, and arrange sources and their visualizations in any layout.
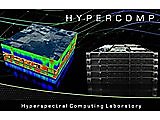 HyperMix is a for unmixing of remotely sensed hyperspectral images It includes several popular algorithms covering different steps of the hyperspectral unmixing chain. It's available pre-packaged for Windows and Ubuntu Linux systems.
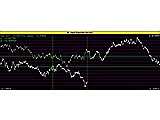 trend is a general-purpose, efficient trend graph for "live" data. Data is read in ASCII form from a file or continuously from a FIFO and displayed in real-time into a multi-pass trend (much like a CRT oscilloscope). trend can be used as a rapid analysis tool for progressive or time-based data series together with trivial scripting.
 Java Swing Component that shows words in different colors and font sizes based on weights.
|