 Zabbix is an enterprise-class distributed monitoring solution designed to monitor and track performance and availability of network servers, devices, and other IT resources. It supports distributed and Web-based monitoring, auto-discovery, real-time monitoring, SLA assurance, trending, and more.
 pv ("Pipe Viewer"), a terminal-based tool for monitoring the progress of data through a pipeline. It can be inserted into any normal pipeline between two processes to give a visual indication of how quickly data is passing through, how long it has taken, how near to completion it is, and an estimate of how long it will be until completion.
 Netvisix listens on your local network interface and visualizes the network packet flow between hosts. Also packet statistics per host are available.
 Grafana allows you to query, visualize, alert on and understand your metrics no matter where they are stored. Create, explore, and share dashboards with your team and foster a data-driven culture: Visualizations: Fast and flexible client side graphs with a multitude of options. Panel plugins offer many different ways to visualize metrics and logs. Dynamic Dashboards: Create dynamic & reusable dashboards with template variables that appear as dropdowns at the top of the dashboard. Ex
 iotop-c does for I/O usage what top(1) does for CPU usage. It watches I/O usage information output by the Linux kernel and displays a table of current I/O usage by processes on the system. It is handy for answering the question "Why is the disk churning so much?". iotop-c requires a Linux kernel built with the CONFIG_TASKSTATS, CONFIG_TASK_DELAY_ACCT, CONFIG_TASK_IO_ACCOUNTING and CONFIG_VM_EVENT_COUNTERS config options on. iotop-c is an alternative re-implementation of iotop in C, optimized for
 Samhain is a file integrity / intrusion detection system that can be used on single hosts as well as on networks. It been designed to monitor multiple hosts with potentially different operating systems, providing centralized logging and baseline database storage, although it can also be used as standalone application on a single host.
 Hashrat is a command-line utility that hashes things using md5, sha1/256/512, whirlpool and jh hash algorithms. It's written in C with few dependancies (basically just the standard C library). It can read input from standard in and hash it, either as a complete file, or line-by-line. It can recursively hash files on disk, either outputing hashes to stdout, or storing them in filesystem attributes, or in a memcached server. It can check files against a list of hashes supplied on stdin, or in t
 This is a daemon that monitors CPU temperature and dynamically changes the clock frequency to keep the CPU below the specified temperature on a Linux computer.
 Monitorix is a free, open source, lightweight system monitoring tool designed to monitor as many services and system resources as possible. It has been created to be used under production Linux/UNIX servers, but due to its simplicity and small size can be used on embedded devices as well.
 PacketFence is a network access control (NAC) manager. It includes numerous features, including user registration and sanitation, central wireless and cable-network control, BYOD (bring-your-own-device) configuration, 802.1X support, and layer-2 device isolation. PacketFence is useful for managing small to large networks and intranet-access points.
 Afick is a fast and portable intrusion detection and integrity monitoring system, designed to work on all platforms (it only needs Perl and a few standard modules), including Windows, Linux, Unix. The configuration syntax is very close from tripwire/aide.
 Webminstats is a Webmin module designed to store system information in an rrdtool database and to display historic (hourly, daily, weekly, monthly, and custom) graphs. It is modular in design, so as to be able to log everything from CPU usage to email box size.
 SigLens is a cutting-edge, purpose-built solution designed to efficiently manage massive volumes of data ranging from terabytes to petabytes, all while optimizing resource utilization. Functioning as a column-oriented database, SigLens incorporates dynamic columnar compressions to achieve an impressive 90% compression across diverse data types, spanning from low to high cardinality datasets. One of SigLens' groundbreaking features is its micro indexing technology, a revolutionary advancement th
 Nmap ("Network Mapper") is a network utility for service discovery, monitoring and security auditing. Nmap utilizes raw IP packets for host discovery, port scanning, OS fingerprinting, firewall probing, and generating various statistics. It permits inspecting large network ranges but also works for single server checks. It's cross-platform compatible and also provides a X11 reporting GUI with Zenmap, and Ncat for data transfer and debugging, Ndiff for result comparison, and Nping for response an
 darkstat is an ntop-workalike network statistics gatherer. It runs as a background process on a cable or DSL router, uses libpcap to capture network traffic, and has a Web interface that serves up reports of statistics such as data transferred by host, port, and protocol, and bandwidth usage graphs.
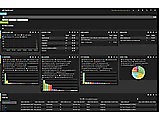 Cyberprobe is a network attack monitoring software stack. It collects data packets for inspection, logging and analysis. It can be integrated with snort to record the actual intrusion source. While Cybermon is highly configurable protocol decoder and analysis tool, which can also automate responses such as dynamic connection resets, firewalling or forged DNS replies.
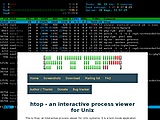 This is htop, an interactive process viewer for Unix systems. It is a text-mode application (for console or X terminals) and requires ncurses.
 Finit is a SysV init replacement that starts services in parallel for a fast init. It comes with process supervision similar to that of daemontools and runit. Although the focus is on small and embedded GNU/Linux systems, it's fully functional on standard server and desktop installations. Cookies included.
 Inadyn is a small and simple DDNS client with HTTPS support, both GnuTLS and OpenSSL are supported. Inadyn is commonly available in many GNU/Linux distributions, used in off-the-shelf routers and Internet gateways to automate the task of keeping your DNS record up to date with any IP address changes from your ISP. It can also be used in installations with redundant (backup) connections to the Internet.
 upsm is public domain, Qt-based ups monitor (front-end for upsc from Network UPS Tools). It sits at the tray and polls nut server using upsc, so you need to set up NUT first (ups.conf and other stuff). From the Settings of upsm you can define the command line for upsc (i.e. "upsc serverups@localhost" for example) and polling time period, in millisecond.
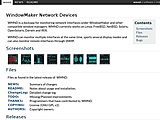 WMND is a dockapp for monitoring network interfaces under WindowMaker and other compatible window managers. WMND can monitor multiple interfaces at the same time, sports several display modes and can also monitor remote interfaces through SNMP.
 NetHogs is a small 'net top' tool. Instead of breaking the traffic down per protocol or per subnet, like most tools do, it groups bandwidth by process. NetHogs does not rely on a special kernel module to be loaded. If there's suddenly a lot of network traffic, you can fire up NetHogs and immediately see which PID is causing this. This makes it easy to identify programs that have gone wild and are suddenly taking up your bandwidth. Since NetHogs heavily relies on /proc, most features are only a
 PHP Server Monitor is a script that checks whether your websites and servers are up and running. Features include monitoring services and websites, email, SMS and Pushover.net notifications and history graphs of uptime and latency.
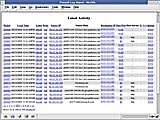 Webfwlog is a Web-based firewall log reporting and analysis tool. It supports IPv6, as well as geoip data for ips using maxmind's geoip databases. It allows users to design reports to use on logged firewall data in whatever configuration they desire. Included are sample reports as a starting point. Reports can be sorted with a single click, or "drilled-down" all the way to the packet level, and report definitions saved for later use. Supported log formats are netfilter, ipfilter, ipfw, ipchains,
 fping is a program to send ICMP echo probes to network hosts, similar to ping, but much better performing when pinging multiple hosts.
 Stresslinux is a minimal linux distribution running from a bootable cdrom, usb, vmware or via PXE. Stresslinux makes use of some utitlities available on the net like: stress, cpuburn, hddtemp, lm_sensors ... Stresslinux is dedicated to users who want to test their system(s) entirely on high load and monitoring the health.
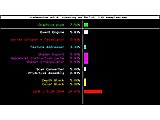 radeontop lets you view GPU utilization on open Radeon drivers. Both the total usage and per-block usage are shown. All cards starting with R600 are supported.
 This is a pure bash/curl/grep/perl plugin for nagios to check health of VSAN clusters. It uses no vmware SDK, just pure unix tools. This plugin can parse malformed XML response.
 top-like cli interface for container monitoring
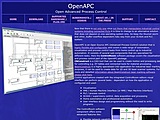 OpenAPC is an APC (Advanced Process Control) solution that is highly flexible and configurable and covers a wide range of automation, visualization, and process control tasks from home control up to industrial automation and manufacturing. The software package is available for many different platforms, so OpenAPC projects can be switched over to a different platform easily. OpenAPC software package consists of ControlRoom (a visualisation and process controlling software consisting of editor, de
 wmsorsen is a dockapp which displays hardware sensor values.
 watcher.js is a Node.js/Express/AngularJS based application that can be used to monitor service status. At regular intervals service specific defined messages, either as http requests or as raw data to sockets, are send to the service endpoints to find out their status. On the service status resolution, the status is stored internally and is made available either programmatically or via REST requests. The application, at design level, is extensible since custom defined behaviors can be easily ap
 downtimed is a program that monitors operating system downtime, uptime, shutdowns, and crashes and records such events. At OS startup it logs information about previous downtime. It then periodically updates a time stamp file on the disk, which is used to determine the approximate time when the system was last up and running. During a graceful system shutdown, it records a time stamp in another file. The downtimes(1) command line tool can be used to inspect records of past downtime.
 SSHGuard is an automated log watcher which quickly sets up firewall blocks for detected brute-force attacks. It supports not just SSH, but also sendmail, exim, dovecot, Cucipop, UWimap, vsftpd, proftpd, pure-ftpd and FreeBSD ftpd. It understands syslog/-ng, metalog, multilog and raw log formats. And works with netfilter/iptables, PF, ipfw, or just hosts.allow to set up firewalling rules.
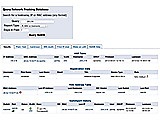 NetDB can inventarize and historize MAC address allocation on network switches and ARP tables on routers. It stores those using MySQL. It supports extensive switch, VLAN and vendor code reports, or tracks static IP addresses, and record neighbor discover. It provides a CLI interface and a web interface, or generate CSV lists.
 TrafGrapher is an javascript script to collect and display data. It can read MRTG log files, or can collect it's own data. Also useable to display SAN storage performance or Nagios performance data. No need for PHP or other daemon on your server. Everything is done in your favorite browser using javascript.
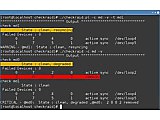 checkraid is a script that uses OEM tools to check the status of RAID arrays. It can be used standalone, with snmpd or nagios nrpe. The script is nagios/icinga compatible. It currently works with Adaptec (arcconf), 3ware (tw_cli), zfs (zpool), and md (mdadm).
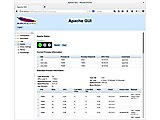 Apache GUI provides a web-based management interface for the Apache HTTP server, implemented in Java and works on Linux and MacOS or Windows setups. It aids editing, searching and validating Apache configuration files, enabling modules, or to edit hosted files through an inline editor, traversing and searching server logs, view or graph statistics and transactions.
 NodeBrain is a rule engine for construction of state and event monitoring applications. It interacts with other monitoring components to perform simple element state monitoring or complex event correlation based on user specified rules. It is extended through the development of node modules (plug-ins) using NodeBrain's C API, and servants (programs written in any language) that interact with the rule engine via stdin, stdout, and stderr. The package includes a small set of plug-in modules to pro
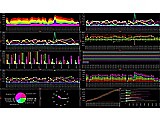 Savors can visualize multiple data streams from arbitrary input pipes. It synchronizes them in accordance to elapsed time, and arrange sources and their visualizations in any layout.
 ENdoSnipe is a Java systems performance profiler and introspection tool. It can monitor a runtime on multiple servers, visalize the application flow (threads and processes in a sequence diagram). It utilizes bytecode instrumentation (BCI) debugging in the JVM to detect possible bugs and performance issues.
 trend is a general-purpose, efficient trend graph for "live" data. Data is read in ASCII form from a file or continuously from a FIFO and displayed in real-time into a multi-pass trend (much like a CRT oscilloscope). trend can be used as a rapid analysis tool for progressive or time-based data series together with trivial scripting.
 Zorka is a sophisticated programmable profiling/monitoring agent for Java suitable for running with production applications. The agent integrates seamlessly with popular monitoring systems and protocols (Zabbix, Nagios, syslog, SNMP) and offers additional tracing/profiling capabilities that - along with the accompanying data collector - help with spotting performance issues and general problems. The agent also exposes JMX data to conventional monitoring systems. Platforms (more or less) suppo
|